使用SpeedScope作性能分析
前言
如果要按工具链友好度评选一门最佳语言,我会首选 Golang,因为它有一系列的go tool工具,面向开发者非常友好。
其中go tool pprof 结合 go-torch ,能快速得出go程序的火焰图。在Linux系统中, perf 工具也十分强大,里面有各种子工具分析系统级进程的性能。perf 通常结合 FlameGraph 可以生成不错的火焰图。在一次偶然的机会中,笔者接触到了 SpeedScope,本文以调优 ClickHouse 为例子,介绍一下 SpeedScope 工具的使用。
SpeedScope 介绍
SpeedScope 是一款在线的 flamegraph 可视化工具。它可以和多个编程语言相结合,也可以将 perf report的结果拖拽到网站里面在线分析。
安装(可选)
speedscope 是 nodejs 编写的,安装这个工具是可选的,安装后可以基于本地生成可视化性能图。
sudo npm install -g speedscope
使用
我们在ClickHouse 里面执行一个”简单“且“复杂“的SQL的SQL,计算十亿个数的平均值。
select avg(number) from numbers(1000000000);
使用 perf 工具"记录"程序性能, 记录10s
perf record -a -F 999 -g -p 17562 sleep 10
如果安装了 speedscope 工具, 我们可以直接在shell中调用
perf script -i perf.data | speedscope -
这个命令会生成一个静态html文件,本地的话可以直接打开进入可视化页面。但笔者并没有这样做,因为笔者在公司服务器作了perf记录,静态html其实是生成了一个到npm modules的跳转,无法拉到本地的浏览器打开。
不过没事,我们可以将生成script拉到本地后,拖拽到 https://www.speedscope.app/ 中打开。
perf script -i perf.data > profile.linux-perf.txt

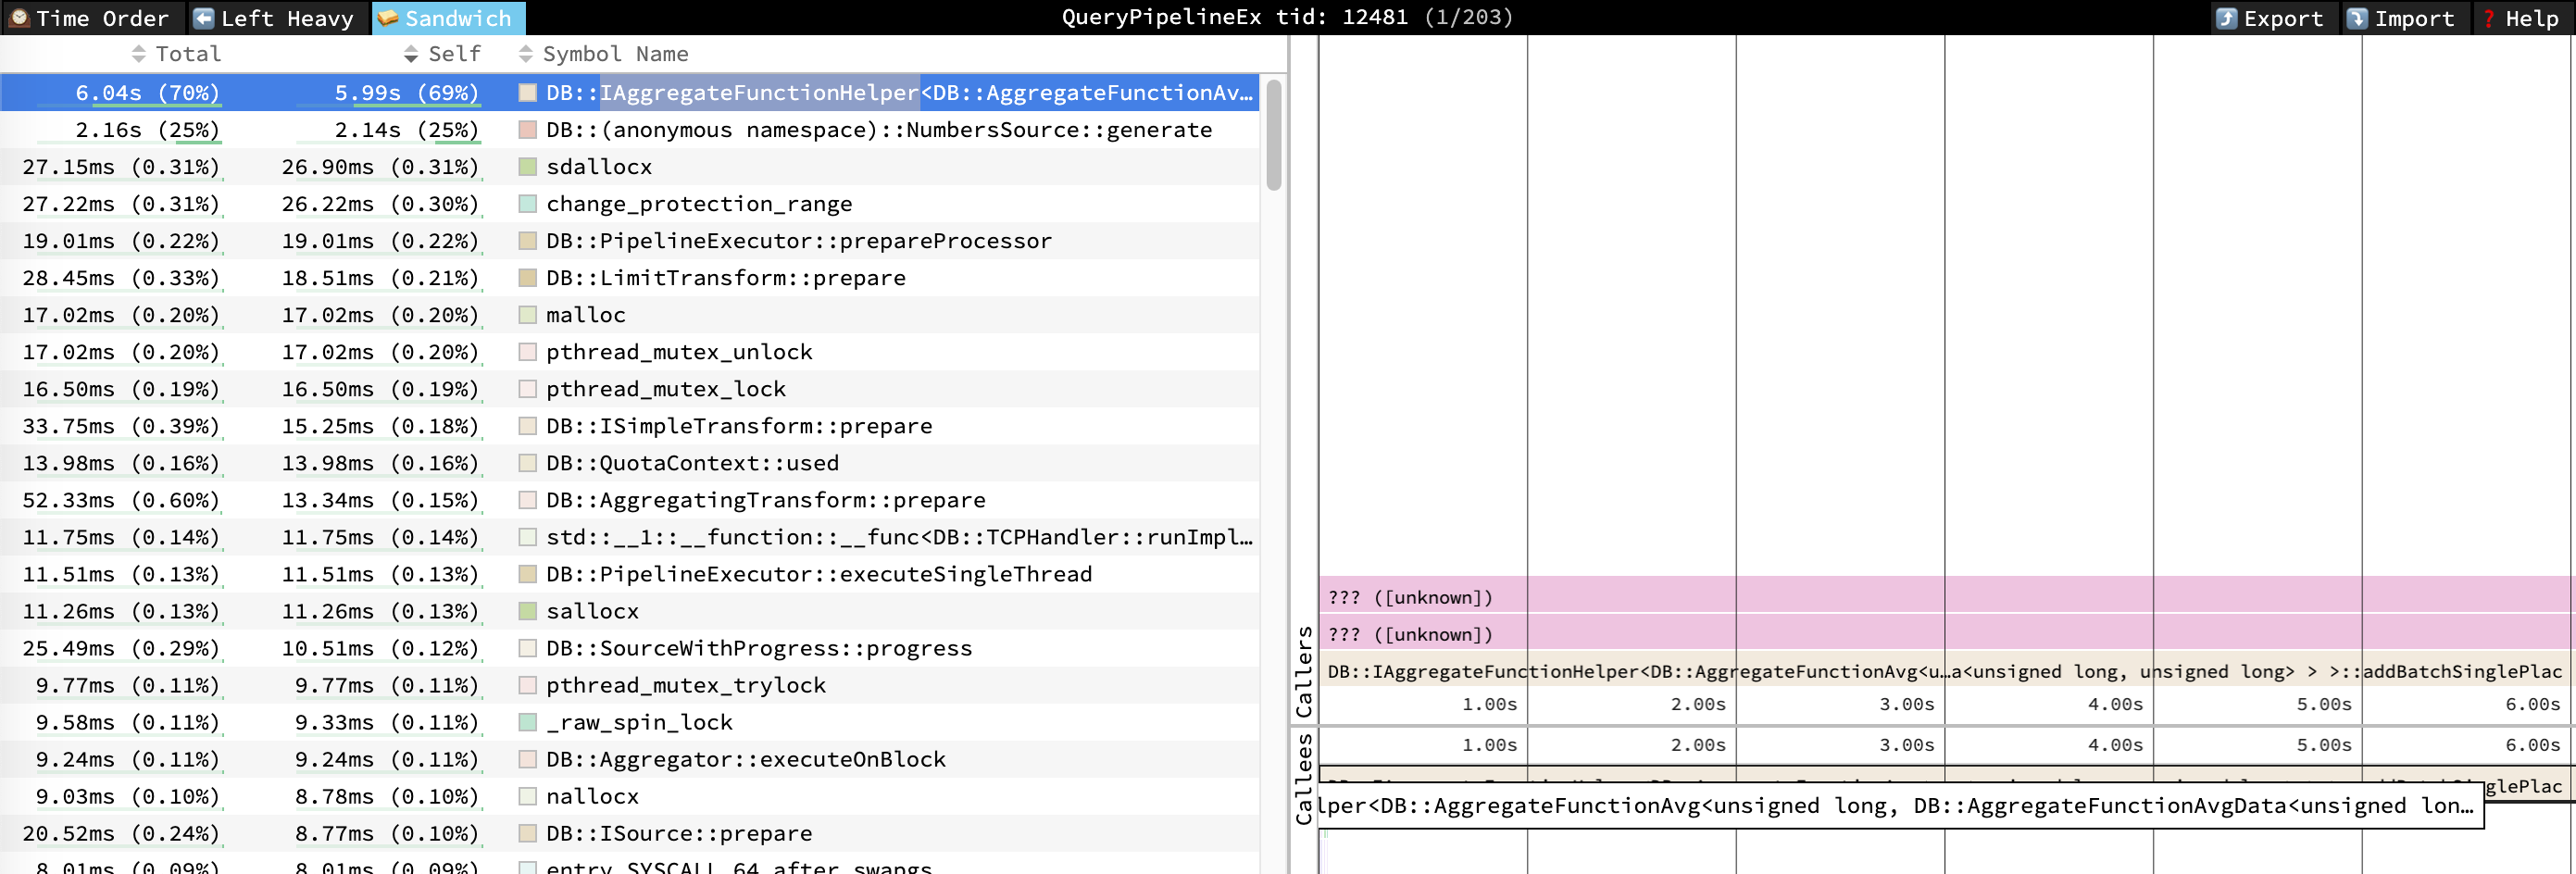
进入页面后,我们可以非常直观地看到各个时间轴上的调用开销时间占用情况。上面截图中,可以反映出,10s内的采样中,有5.99s 耗在 AggregateFunctionAvg 函数中, 有 2.14s 耗在 NumbersSource::generate 生成中。
使用 Perf 的方式,我们可以很直观得看到性能图,但我们并不能针对特定的SQL进行profile,下面介绍下 clickhouse-speedscope 如何针对特定SQL进行profile。
clickhouse-speedscope
第一次接触到SpeedScope,是无意中看到了 clickhouse-speedscope 项目。这个项目巧妙地利用了 clickhouse的系统表 system.trace_log 进行采样。
注意:要使用
system.trace_log,必须安装好clickhouse-common-static-dbg库, 并且开启allow_introspection_functions等参数,更多配置参数参考这里.
Clone clickhouse-speedscope 后,发现代码非常简单,核心就一个python文件,监控了http端口进行处理请求的返回。
- pip安装好依赖库后,我们首先开启下端口监听 8089端口,同时会转发 query_id 查询 服务器域名为ck001 的clickhouse-server
python main.py --ch-host ck001 --proxy-port 8089
- 然后,我们在 clickhouse 层执行SQL,这里为了方便快速获取 query-id ,我们打开logs输出,以及打开函数抽样trace的开关
ubuntu :) set send_logs_level = 'trace';

SET send_logs_level = 'trace'

Ok.

0 rows in set. Elapsed: 0.021 sec.

ubuntu :) set allow_introspection_functions  = 0;

SET allow_introspection_functions = 0

[ubuntu] 2020.09.11 23:02:13.061146 [ 17134 ] {d4a0c7af-c836-4360-8264-926f634e1d94} <Debug> executeQuery: (from 127.0.0.1:52012) SET allow_introspection_functions = 0
[ubuntu] 2020.09.11 23:02:13.061471 [ 17134 ] {d4a0c7af-c836-4360-8264-926f634e1d94} <Debug> MemoryTracker: Peak memory usage (for query): 0.00 B.
Ok.

0 rows in set. Elapsed: 0.042 sec.
- 这里我们就可以看到具体日志了,然后我们继续执行那个”简单“且“复杂“的SQL (线上40core 128G服务器)
ubuntu :) select avg(number) from numbers(1000000000);

SELECT avg(number)
FROM numbers(1000000000)

[ubuntu] 2020.09.11 23:03:58.739452 [ 17134 ] {6e4b5384-39c5-4d02-9383-e312e92f2681} <Debug> executeQuery: (from 127.0.0.1:52012) SELECT avg(number) FROM numbers(1000000000)
→ Progress: 0.00 rows, 0.00 B (0.00 rows/s., 0.00 B/s.) [ubuntu] 2020.09.11 23:03:58.739624 [ 17134 ] {6e4b5384-39c5-4d02-9383-e312e92f2681} <Trace> AccessRightsContext (default): Access granted: numbers() ON *.*
[ubuntu] 2020.09.11 23:03:58.739649 [ 17134 ] {6e4b5384-39c5-4d02-9383-e312e92f2681} <Trace> AccessRightsContext (default): Access granted: numbers() ON *.*
[ubuntu] 2020.09.11 23:03:58.747053 [ 17134 ] {6e4b5384-39c5-4d02-9383-e312e92f2681} <Trace> InterpreterSelectQuery: FetchColumns -> Complete
[ubuntu] 2020.09.11 23:03:58.747139 [ 17134 ] {6e4b5384-39c5-4d02-9383-e312e92f2681} <Debug> executeQuery: Query pipeline:
Expression
 Expression
  Aggregating
   Concat
    Expression
     TreeExecutor

↘ Progress: 75.96 million rows, 607.65 MB (699.98 million rows/s., 5.60 GB/s.)  7%[ubuntu] 2020.09.11 23:03:58.747262 [ 28335 ] {6e4b5384-39c5-4d02-9383-e312e92f2681} <Trace> Aggregator: Aggregating
[ubuntu] 2020.09.11 23:03:58.747377 [ 28335 ] {6e4b5384-39c5-4d02-9383-e312e92f2681} <Trace> Aggregator: Aggregation method: without_key

┌─avg(number)─┐
│ 499999999.5 │
└─────────────┘
↖ Progress: 951.06 million rows, 7.61 GB (746.09 million rows/s., 5.97 GB/s.) █████████████████████████████████████████████████████▎   94%[ubuntu] 2020.09.11 23:04:00.013119 [ 28335 ] {6e4b5384-39c5-4d02-9383-e312e92f2681} <Trace> Aggregator: Aggregated. 1000000000 to 1 rows (from 7629.395 MiB) in 1.266 sec. (790016853.437 rows/sec., 6027.350 MiB/sec.)
[ubuntu] 2020.09.11 23:04:00.013271 [ 28335 ] {6e4b5384-39c5-4d02-9383-e312e92f2681} <Trace> Aggregator: Merging aggregated data
[ubuntu] 2020.09.11 23:04:00.013537 [ 17134 ] {6e4b5384-39c5-4d02-9383-e312e92f2681} <Information> executeQuery: Read 1000013824 rows, 7.45 GiB in 1.274 sec., 784921953 rows/sec., 5.85 GiB/sec.
[ubuntu] 2020.09.11 23:04:00.013576 [ 17134 ] {6e4b5384-39c5-4d02-9383-e312e92f2681} <Debug> MemoryTracker: Peak memory usage (for query): 137.09 KiB.

1 rows in set. Elapsed: 1.275 sec. Processed 1.00 billion rows, 8.00 GB (784.34 million rows/s., 6.27 GB/s.)
- 拿到了query-id,之后,我们通过 curl 可以直接获取到traceing的结果。
curl 'http://localhost:8089/query?query_id=fe9078cd-9570-4895-b328-4728a097306a' | speedscope -
- 如果没有装
speedscope, 也可以重定向到一个文件中,然后拖拽到https://www.speedscope.app/中。
总结
使用 speedscope, 我们在本地就可以很方便地对 ClickHouse 进行远程 profile,去试试吧!
